| HeyWhatsThat Technical Frequently Asked Questions |
| Home General FAQ and Site Map |
This is the Technical FAQ for HeyWhatsThat.com. Be sure to visit the main site, whose mission is to tell you the names of the mountains you can see when you're standing almost anywhere in the world, and the general FAQ, which lists all the features that HeyWhatsThat has to offer. And please sign up for our occasional email announcements.
I'm trying to use the Path Profiler to analyze point-to-point radio/TV/wifi/microwave communications. How can I specify elevations for the transmitting and receiving antennas?
The easiest way to use the API might be to lay out the path, grab
the URL of the profile image (in my browser I can
right-click on an image and "Copy image URL") and edit it,
e.g. change
&pt0=43.834527,-100.195312,ff0000& ...
to
&pt0=43.834527,-100.195312,ff0000,17& ...
to specify that the first point is 17 meters above sea level.
(Well, not quite LOS, because it includes the effect of visible light refraction, which, while small, is probably not appropriate for the frequencies you're using. )
For a wifi network, you could run the computation for a bunch of nodes, and give out URLs like http://www.heywhatsthat.com/?view=XXXXXXX to show the coverage of each node. (And then you could even load the the KML for all the nodes into Google Earth and turn on all the viewsheds to show your total coverage.)
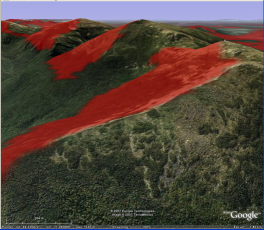
Visibility cloak (aka viewshed)
We compute an image of red dots that show the particular spots on the earth's surface that are visible from the viewer's location. A pixel is 3 arcseconds latitude by 3 arcseconds longitude, roughly 2 acres.(At the equator a pixel covers a square of length 304ft (93m); at latitude +/-45° it covers a rectangle whose height is the same 304ft (93m) and whose width is reduced by cos 45° to 215ft (65m).)
This looks particularly cool in Google Earth, where you can turn on the pixel-by-pixel visibility cloak, zoom in on some ridge, and tilt the terrain so you can see one side of the ridge lit up in red -- it's visible to the viewer -- and the other side dark.
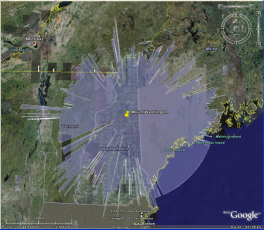
In Google Earth we also provide the Entire visible area cloak, which shows the maximum extent you can see in every direction; one reviewer pointed out, poetically, that it's your horizon.
Google Earth uses what they call "simple cylindrical projection," which is also known as Plate Carrée (cf. Google Earth image overlays). Google Maps uses the Mercator projection. (Recently they've added the GOverlay class to the Maps API and we haven't yet looked to see what projection it requires.) So, we create images in both formats. The difference? At 45° latitude, in middle of 1200 pixel image covering a 1° square, we shift up about 3 pixels.
Profile
If you open the profile pane, whenever you click on the map we'll draw the vertical profile from the viewer to that point. And yes, you can zoom out and traverse the entire US and get a meaningful result (though you'll have to wait for it).
The path we follow from viewer to endpoint -- purely out of laziness -- is linear in latitude and longitude. In terms of map projections, you can say it's a straight line on a Plate Carrée projection. In particular, it isn't a rhumb line (i.e. a line of constant bearing), nor a great circle route. It's really what you'd expect if you knew nothing about map projections at all: the line from 30N 120W to 40N 80W runs through the point 35N 100W.
But Google Maps uses the Mercator projection. So you're thinking that the path drawn on the map and the path actually traversed in computing the profile must diverge somewhat. For example, that line from 30N 120W to 40N 80W, if it's a straight line on a Mercator projection, should pass through 35.1534N 100W, about 10 miles to the north of 35N 100W. But it appears that as you zoom in, Google also uses linear calculations in latitude and longitude to clip line segments -- rather than staying true to the Mercator projection and incurring large computational costs for fairly small deviations -- so in fact our profile's path does pretty much match the line we draw. If you look at our tiling example (discussed in more detail below under Contours) you can enable the line and points we talk about here, and you'll see where the line runs as you zoom in.
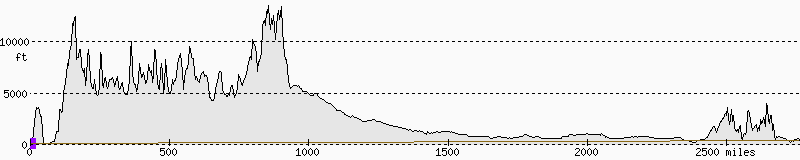
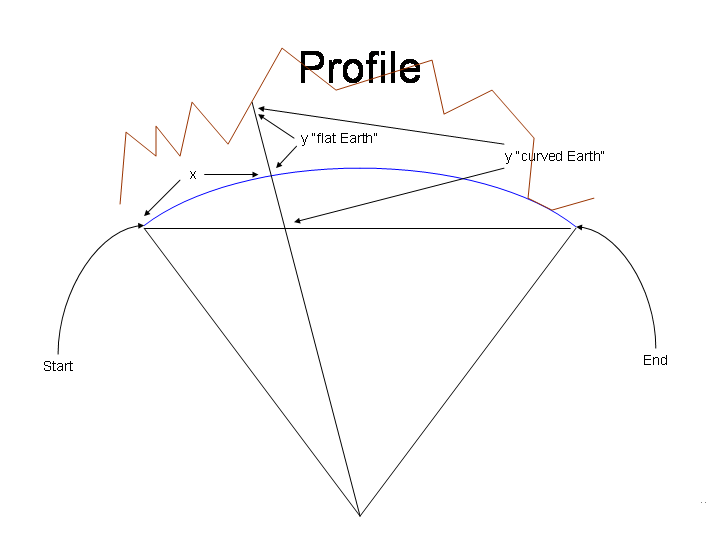
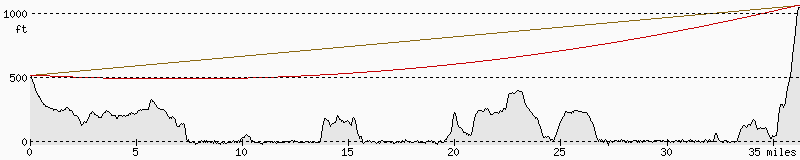
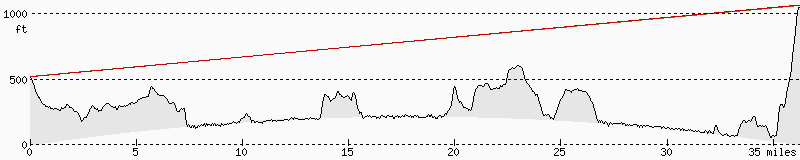
The profile can be drawn on either a flat earth
or a curved earth
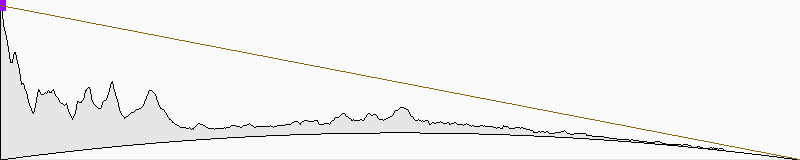
For flat earth, we simply show the elevation above sea level. For curved earth, we show the distance above the chord running from start point to end point. The curved earth graph is not a cross-section, indeed it's not any kind of linear projection, so in particular the Earth's surface isn't circular but rather has a 1 / cos in it.
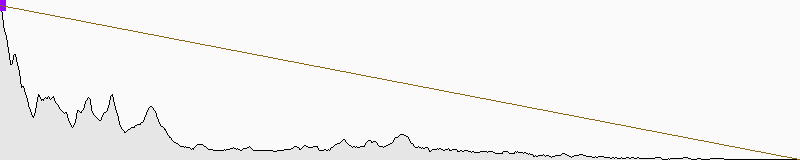
The lines we draw on the profiles are simply straight lines. On flat earth profiles the lines let you easily compare elevations but are not actual lines of sight.
In this figure, the true line of sight is in red and the straight line is brown.
On curved earth profiles, the lines are close to true lines of sight, and at this resolution you can't really see a difference; again, this image has a red and a brown line.
Note that these straight lines do not reflect the effects of refraction that we include in computing the panaromas and visibility cloaks.
Why not just draw a cross-section — e.g. a flat projection onto the screen — and be done with it? It would be tricky to show curved earth profiles with multiple legs, but maybe it would be simpler to understand ...
The shape of the Earth
We use the WGS84 reference ellipsoid for calculating the visible peaks and the visibility cloak. For profiles and any cases where a single radius is necessary, we use the ellipsoid quadratic mean radius. Big thanks to Wikipedia for the dozens of articles on these issues, most notably Figure of the Earth, Earth Radius, and WGS 84.Terrestrial refraction
Because of refraction, the further away an object is, the higher it will appear. How much higher? We add about 3.6 arc seconds to the altitude of an object for every mile away from the viewer, which is 14% of the amount that a distant object's height is reduced by the curvature of the earth.We arrive at this figure by starting with what several surveying references give as the standard adjustment to a distant object's height due to both the curvature of the Earth and refraction: .574 feet times the distance in miles squared (e.g. Harbin, Land Surveyor's Reference Manual, Professional Publications, 1998, p. 21-12). If you look at the geometry, and use 3960 miles as the radius of the Earth, you'll conclude that 5280/(2*3960) = .666 of this is due to curvature, so .666 - .574 = .092 is due to refraction, and .092/.666 is about 14%. (Note that curvature and refraction work in opposite directions; the curvature of the Earth makes distant objects look lower, and refraction makes them look higher.)
Unfortunately refraction depends on lots of variables -- temperature and atmospheric pressure and elevation, for instance -- so we'll never have an exact panorama.
Including refraction reduces the number of peaks detected from some locations, because it raises distant land enough that peaks that would otherwise appear against the horizon -- and currently the algorithm requires peaks to be against the horizon to be detected -- now have land visible beyond them. On the other hand, it brings Baxter Peak (the summit of Mount Katahdin, the highest peak in Maine and the start of the Appalachian trail) onto the list of peaks detected from Cadillac Mountain in Acadia National Park.
Contours
We do this with Google Maps's GTileLayerOverlay. I've seen lots of inaccurate stuff on the net about this, so here's my attempt at explication. (Part of the problem is that this stuff changed between version 1 and version 2 of Google Maps; here I only discuss version 2.)Google Maps uses the Mercator projection. This means that a point on the Earth with a particular latitude and longitude gets mapped to a sheet of paper by leaving its longitude as is, and converting its latitude to what we're calling here the mercator latitude. The conversions back and forth are
mercator latitude = ln (sec(latitude) + tan(latitude)) = .5 ln ( (1 + sin(latitude)) / (1 - sin(latitude)) )
latitude = arcsin ( (exp(2 * mercator latitude) - 1) / ((exp(2 * mercator latitude) + 1) )
For example, consider those points we were fussing about above. 30°N 120°W gets mapped to (.54931,120) and 40°N 80°W gets mapped to (.76291, 80). The midpoint of the line drawn between them on a Mercator chart is therefore (.65611, 100), which, applying the inverse formula, corresponds to 35.1534°N, 100°W.
Looking closely at the Google Maps map at widest zoom, you'll see that latitude runs from about +85° to -85°. Where does this come from? Well, the above equations give us equal horizontal and vertical scales at the equator when you measure longitude in radians. When we view the entire world we're running horizontally from -180° to 180°, or -PI to PI radians. If we want to map onto a square tile and keep the equal scales at the equator, then we need the mercator latitude to run from -PI to PI. Using mercator latitude = PI in the second formula yields a real latitude of about 85°N; -PI yields 85°S.
The Google map code sends requests for tiles using x, y, and zoom. zoom starts at zero where a single tile covers the full rectangle 85°S,-180°W to 85°N,180°W, and each increase in zoom level cuts both the horizontal and vertical extent of a tile in half, quadrupling the number of tiles. x measures longitude increasing eastward, where x = 0 is at longitude -180°; y measures latitude increasing southward, with y = 0 at the north pole (or rather at mercator latitude +PI or real latitude 85°N).
www.heywhatsthat.com/gmt.html hopefully illustrates all this better than the above explains it. Here's the interesting part of that page's javascript code:
    var map = new GMap2(document.getElementById("map_div"));
    map.setCenter(new GLatLng(0, 0), 0);
    map.addControl(new GLargeMapControl());
    map.addControl(new GMapTypeControl());

    	// GMaps Bug?? copyright stuff doesn't seem to work??
    var c = new GCopyrightCollection('Tiles (C) 2007');
    c.addCopyright(new GCopyright(27, new GLatLngBounds(new GLatLng(-90,-180), new GLatLng(90,180)), 0, 'MK'))

    var t = new GTileLayer(c, 0, 20);
    t.getTileUrl = function(point, zoom) { return 'bin/gmt.cgi?x=' + point.x + '&y=' + point.y + '&zoom=' + zoom; };
    t.getOpacity = function()            { return 1; }
    t.isPng      = function()            { return 1; }

    map.addOverlay(new GTileLayerOverlay(t));
And here's some of the Perl CGI code it calls (full text available here):
    use constant PI => 4 * atan2(1, 1);
    sub degrees_to_radians { return $_[0] * PI / 180; }
    sub radians_to_degrees { return $_[0] * 180 / PI; }

    	# .5 ln( (1 + sin t) / (1 - sin t) )
    sub mercator {
        my $s = sin(degrees_to_radians($_[0]));
        return radians_to_degrees(.5 * log((1 + $s) / (1 - $s)));
    }

    	# arcsin((e^2x - 1)/(e^2x + 1))
    sub inverse_mercator {
        my $e = exp(2 * degrees_to_radians($_[0]));
        $e = ($e - 1)/($e + 1);
        return radians_to_degrees(atan2($e, sqrt(1 - $e * $e)));
    }


    my $x    = param('x');
    my $y    = param('y');
    my $zoom = param('zoom');

    my $d              = 2 ** $zoom;
    my $lon_extent     = 360/$d;
    my $merclat_extent = 360/$d;

    		# (lat1, lon0) is upper left of tile
    my $l = 180 - $y * $merclat_extent;
    my $lat1 = inverse_mercator $l;
    my $lon0 = $x * $lon_extent - 180;
    my $lat0 = inverse_mercator $l - $merclat_extent;
    my $lon1 = $lon0 + $lon_extent;

    		# tiles are 256 x 256
                # draw a rectangle indented one pixel on each side
    		# mark the edges with the latitude and longitude
    use GD;
    my $im = new GD::Image(256, 256);
    $im->colorAllocateAlpha(255, 255, 255, 127); # transparent background
    my $fg = $im->colorAllocateAlpha(0, 0, 0, 0);

    $im->string(gdSmallFont,  10, 128, $lon0, $fg);
    $im->string(gdSmallFont, 190, 128, $lon1, $fg);
    $im->string(gdSmallFont, 100,  10, $lat1, $fg);
    $im->string(gdSmallFont, 100, 220, $lat0, $fg);
    $im->string(gdSmallFont, 30, 60, 'x=' . $x . ' y=' . $y . ' zoom=' . $zoom, 1);

    my $a0 = 1;
    my $a1 = 254;
    $im->line($a0, $a0, $a0, $a1, 1);
    $im->line($a0, $a1, $a1, $a1, 1);
    $im->line($a1, $a1, $a1, $a0, 1);
    $im->line($a1, $a0, $a0, $a0, 1);

    print "Content-Type: image/png\n\n", $im->png;
Strictly speaking, the contents of a tile should be drawn according to the Mercator projection (briefly discussed above).
Do you get the elevations from Google Maps? How can I use elevation data in my own web site?
No, elevation data doesn't come from Google Maps or Google Earth. We downloaded all the USGS SRTM data files and wrote C++ code to read them. There's some description of the data in our general FAQ, and some sample code for reading SRTM files at the bottom of this FAQ.If you have an application you think we could help with, please get in touch.
New in April 2010: Google has made its data available through the Google Maps Elevation Web Services. You can request the elevations of individual points and of entire paths.
And here are some other public APIs we've come across for obtaining elevation data in a web app:
Can I use any of this on my own site?
We discuss below a few APIs that you are welcome to experiment with. If you want to use the system for more than just experimenting, please drop us a line.Note that all these interfaces are subject to change at any time without notice. When possible, we'll notify our mailing list of changes before they happen; sign up here.
You can create a URL for Google Sky to compute the the horizon and an az-alt grid for any location for any time. If the location is the result of a panorama query, then you get the true horizon with summits marked on it; if it's specified as a latitude and longitude you get a flat horizon (i.e. altitude uniformly 0°), rather than trying to compute the true horizon by finding all the mountains. Arguably this is adequate for most applications -- one seasoned amateur astronomer pointed out that your horizon can be off by even five degrees and you generally don't care, because most of the time you're looking higher in the sky -- but then you can't answer questions like "Hey, what's that right above Mount Rainier?"
We discuss the planisphere in more detail in the planisphere FAQ.
The URL should look like http://www.heywhatsthat.com/bin/planisphere.kmz?param=...¶m=... where the available parameters are:
| id | the ID of a panorama; if you view the panorama and hit the Print tab you'll see the ID under the name on the right side of the page |
| lat lon | rather than specify an ID you can specify a latitude and longitude |
| date | run the computation at the specified time The date is decoded by the Perl Date::Parse module, so you can use any of its formats. Use plus signs where you want to put spaces. See example below, particularly as to time zones. |
| tz | Time zone (safest to use the +/-HHMM format) |
| addhours | run the computation for a time the given number of hours in the future (decimals and negative numbers should work fine) |
| time | run the computation at the specified UNIX time (seconds since 1/1/1970 0h UTC) |
| n | create an animation with the given number of frames rather than a single sky view |
| interval | time between frames in seconds (default 600 secs or 10 minutes; remember that an hour is 3600 seconds and a day is 86400 seconds |
| flyto | object to bring into view when you load this KML |
| flytoazalt | azimuth, altitude to center when you load this KML (e.g. &flytoazalt=245,10) |
| flytoradec | ra, dec to center view when you load this KML |
| flytofov | field of view around that object (degrees, roughly; default is 80; max is 80) |
| refraction | set to 0 to not include astronomical refraction (astronomical refraction is on by default since June 2012) |
| temperature | temperature °C for refraction (default 15°C) |
| pressure | atmospheric pressure in millibars for refraction (default 1013.25 mb) |
If no date or time are specified, it uses the current time. The planisphere FAQ discusses animation in more detail.
The URL described above can be used in a browser to retrieve the KML file, and if the system is properly configured it should automatically load into Google Earth. It can also be entered as a Network Link in Google Earth — click on Network Link under the Add menu and enter the URL in the appropriate box — and you can refresh it whenever you want to update your view to the current time. If you substitute planisphere_link.kml for planisphere.kmz and type the URL into a browser, then you'll receive a KML file containing a Network Link rather than the computed overlays, which should, again, automatically load into GE and can be refreshed at any time.
Here are some examples. Remember, if you click on one of these links you'll load the data into Google Sky; if you copy the URL and create a Network Link you can refresh it any time to load your current horizon. Note that the Network Link mechanism only makes sense for URLs that don't specify a fixed time with the date parameter; if you created a Network Link from the second example below it would yield the same result every time you refreshed it.
You can write a URL to generate an arbitrary terrain profile, as appears in the Path Profiler and the Path Profiler mapplet. The result is a PNG image. (Sorry, there's no API for the data underlying the image. But here's some code for reading SRTM files.)
The URL should look like http://profile.heywhatsthat.com/bin/profile.cgi?pt0=lat,lon,lcolor,elev,mcolor&pt1=...&src=...¶m=...
| ptX=lat,lon,line color,elevation,marker color | ||
|
X must start at 0 and increment by 1 (no leading zeroes, just 0, 1, ... 9, 10, 11 ...). line color is the color used to draw straight line segments from this point to the next point that either has a line color set, has the special line color end, or is the last point of the request. So to draw a straight red line between the fourth, seventh and tenth points, ignoring any intervening points, set line color on the fourth and seventh to ff0000 and the tenth to end. elevation is of this marker in meters above sea level (e.g. draw the line to top of an antenna rather than the ground). | ||
| axes=1 | include grid lines and a scale | |
| metric=1 | show Metric rather than English units on the scale | |
| groundrelative=1 | elevations are relative to ground rather than sea level | |
| curvature=1 | include the curvature of the Earth in the graphic | |
| width=999 | width of image in pixels; default is 800 (limit is 1600 pixels wide) | |
| height=999 | height of image in pixels; default is 160 (limit is 500 pixels high) | |
| src=XXXX | a simple identifier we can use to know who's making the request. (If your site is www.example.com, use something like src=example. Please let us know who you are and what you're using as an id.) | |
There are restrictions on the size of a URL you can pass to the server. Our server limits incoming URLs to about 8000 bytes, and while Firefox will send URLs of that size, Internet Explorer has a lower outgoing limit of about 2000 bytes. So figuring the majority of points look like
&pt99=99.999999,-99.999999
and rounding up a bit to 30 chars per point, we can estimate the maximum number of points in a profile at 70 points for IE and 270 for browsers that don't impose their own limits.
Here are some examples:
This API is free for use in non-commercial, low volume applications. For anything else please get in touch. If you use these profiles on your site, include a copyright notice similar to
Profile image is Copyright 2014 Michael Kosowsky. All rights reserved. Used with permission.
and we'd appreciate a link, e.g.
For more information visit HeyWhatsThat.
Sign up for our mailing list and we'll warn you of impending API changes when we can.
You can add our contours to your own Google Map using the GTileOverlay mechanism. Here's one way to do it (note the host name contour.heywhatsthat.com):
  tile_overlay = new GTileLayerOverlay(new GTileLayer(null, null, null, {
    tileUrlTemplate: 'http://contour.heywhatsthat.com/bin/contour_tiles.cgi?zoom={Z}&x={X}&y={Y}&color=ff0000&interval=1000&src=XXX'
    }));
  map.addOverlay(tile_overlay);
The parameters to be passed to contour_tiles.cgi are:
| zoom x y | zoom, x and y as per the GMaps documentation (these are passed into the template and you shouldn't need to worry about them) |
| color | color of contours in RRGGBB or RRGGBBAA format, default 83422530 (brown) |
| interval | contour interval in meters |
| src | a simple identifier we can use to know who's making the request. (If your site is www.example.com, use something like src=example. Please let us know who you are and what you're using as an id.) |
These computations can put significant load on our servers, so please get in touch with us before you publicly release your application.
Contours don't look particularly good at high zoom levels because of the resolution of the data we use, and we make no attempt to smooth the contours.
We enforce a minimum contour interval for every zoom level. In meters, the minimums are roughly zoom 0 to 4: 200m, 5 to 7: 80m, 8: 40m, 9: 20m, 10 to 13: 8m, 14: 4m, 15: 2m, 16 and above: 0.8m. So, for example, at zoom level 4 you'll get an error if you ask for contours closer than 200 meters apart. If you don't specify an interval, you'll get a default interval that draws reasonable looking contours, corresponding to about four times the above values.
Note the use of null for the copyright associated fields in the GTileLayer constructor. It seems that the copyright mechanism only works in tile layers -- layers that replace Google's map layers -- not tile layer overlays. In particular, this means you can't rely on our copyright message appearing on the map and you must place it somewhere else.
This API is free for use in non-commercial, low volume applications. For anything else please get in touch. If you use these contours on your site, include a copyright notice similar to
Contours Copyright 2014 Michael Kosowsky. All rights reserved. Used with permission.
and we'd appreciate a link, e.g.
For more information visit HeyWhatsThat.
Sign up for our mailing list and we'll warn you of impending API changes when we can.
Can I have your code for reading SRTM files?
We haven't freed any of our source code, but here's a working C program anyone can freely use to read an elevation from an SRTM file. It's not the code we currently use, in particular it hasn't been exhaustively tested, so use at your own risk.The interesting lines of code are:
We put all the SRTM files for a particular resolution in a directory; here we use /opt/srtm-1arcsecond (with 1117 files) and /opt/data/srtm-3arcsecond (14548 files). A typical file name is S10W012.hgt (note that we're using the extension .hgt not .HGT). The HGT files are named based on the point at their SW corner (I can't find the HGT file format reference right now; poke around the JPL SRTM site). So you need the floor() of the desired lat and lon:
  ilat0 = floor(lat);
  ilon0 = floor(lon);

  snprintf(buf, sizeof buf, "%s/%c%02d%c%03d.hgt",
				  	  	   dir,
				  	  	   lat >= 0? 'N' : 'S',
				  	  	   abs(ilat0),
				  	  	   lon >= 0? 'E' : 'W',
				  	  	   abs(ilon0));
The first word in the data corresponds to the NW corner of the one-degree square. It then runs in increasing longitude order to the NE corner, then back to the western edge and the next lower line of latitude, and so on.
Adjacent files overlap one row or column, so for instance for the 1 arcsecond files the grid spacing is 1/3600 of a degree but there are 3601 samples.
  #define BYTES_PER_SAMPLE 2
  samples_per_degree = n_samples - 1;

  row = round((ilat0 + 1 - lat  ) * samples_per_degree);
  col = round((lon       - ilon0) * samples_per_degree);

  lseek(fd, BYTES_PER_SAMPLE * (row * n_samples + col), SEEK_SET);
  read(fd, dbuf, BYTES_PER_SAMPLE);

	  /* WARNING: assumes SRTM file is big-endian and we're on a little-endian architecture */
  _elev = dbuf[1] | (dbuf[0] << 8);
  _lat = ilat0 + 1 - 1. * row / samples_per_degree;
  _lon = ilon0     + 1. * col / samples_per_degree;
Be careful about sign extension, particularly when comparing the returned elevation against the -32768 they use to indicate data voids
How do I contact you?